Introduction
A few months ago, I created a database that includes all of the prospect rankings from Baseball America, Keith Law and Kevin Goldstein. I didn't have a direct purpose for it, I'm just the type of person who likes to accumulate as much data as possible. So it sat around on my computer until I found a good use for it. Well, thanks to fantasy baseball and Starling Marte's horrible 3.8% walk rate in AA last season, I have. Marte is a possible target in my dynasty minor league draft and I wanted to see what other prospects had poor walk rates and how successful they were in their careers.
Method
In interest of saving digital space (and your scrolling finger), I will only post the full method on the Rookie and Low-A edition of this series.
I have added a new feature, which includes 2007-2012 prospects. I followed exactly the same procedure as before in determining the very low to very high categories for current prospects or younger players. I listed only the top 10 or so for each category, instead of all players who fit that description.
History
Rookie and Low-A
Single-A
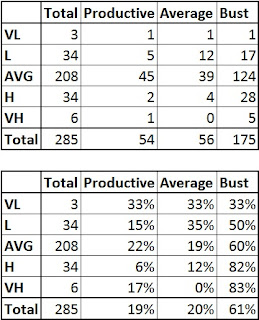
285 of the 480 prospects in this dataset accumulated at least 150 plate appearances in Single-A. This is quite a leap from the 111 number in Low-A, so the overall numbers here are a bit more interesting. 19% were successful, 20% were average and 61% were busts. This is much closer to the overall 21/21/58 trend for all prospects.
Walks
Prospects in Single-A with an above average walk rate have been successful 13% more often than those with a below average rate. A 27% success rate for prospects with an above average walk rate is well above normal. A 15% success rate for those with a below average walk rate is below normal, but it's still not exceedingly bad. The three busts with very high walk rates in Single-A were Darren Lewis, Ray McDavid and Kerwin Moore. Grady Sizemore is the lone productive hitter in that category.
Correlation to MLB
This graph shows the correlation between Single-A walk rates and MLB walk rates.
Click to enlarge
I noticed a very interesting trend here. Almost all of the green dots (productive hitters) are above the trend line. That means that these hitters had a higher MLB walk rate than expected based on their Single-A rate.2007-2012 Prospects
High Walk Rate: Aaron Hicks, Chris Parmelee, James Darnell, Jaff Decker, Derek Norris, Wil Myers, Mike Trout, Brent Lillibridge, Daric Barton, Max Ramirez, Joey Votto, Chris Iannetta, Nick Weglarz
Low Walk Rate: Josh Vitters, Engel Beltre, Erick Aybar, Carlos Triunfel, Chris Owings, Alcides Escobar, Christian Bethancourt, Neil Walker, Angel Villalona
Strikeouts
The lone category that provides an above-average success rate for strikeouts is the average one (after removing the Very Low category with only three players). Only 16% of players with below average strikeout rates became productive. That number drops to 7.5% of players with above average strikeout rates. In this analysis, a below-average strikeout rate for a hitter is a good thing (strike out fewer times than average).
The lone bust with a very low strikeout rate was Enrique Wilson. The three productive hitters with high strikeout rates were Ryan Howard, Travis Hafner and Russell Branyan.
2007-2012 Prospects
High Strikeout Rate: Greg Halman, Kyle Skipworth, Chris Parmelee, Robbie Grossman, Michael Burgess, Joey Votto, Elijah Dukes, Will Middlebrooks, Javier Herrera, Mike Stanton, Trayvon Robinson
Low Strikeout Rate: Alberto Callaspo, Carlos Gomez, Ben Revere, Andy LaRoche, Michael Brantley, Kolten Wong, Gerardo Parra, Erick Aybar, Daric Barton, Scott Sizemore
Correlation to MLB
This graph shows the correlation between Single-A strikeout rates and MLB strikeout rates.
Click to enlarge
The trend here is not as noticeable as the walk rate chart, but a lot of the green dots are below the trend line. They had a lower MLB K rate than was expected based on Single-A.Strikeout to Walk Ratio
Finally, this plot shows the relationship between Single-A K/BB and Major League Batting Runs per Plate Appearance:
Click to Enlarge
This graph looks very similar to the Low-A one. The r^2 value is slightly higher, but there is little to no predictive value in it. I'm not certain these will ever provide a solid answer, but they look pretty.Conclusion
With a little bit better of a sample size, I can say that if a prospect has a below average walk rate in Single-A, he probably has a lower chance of succeeding as a hitter. If his walk rate is above average, his chances of success are much better. If he strikes out too much in Single-A though, his chances are severely diminished. If you would like to know anything specific about the data, you can contact me in the comments section below or on Twitter @stealofhome.


1 comment:
good stuff :) i wonder if a study using ISO would provide similar results
Post a Comment